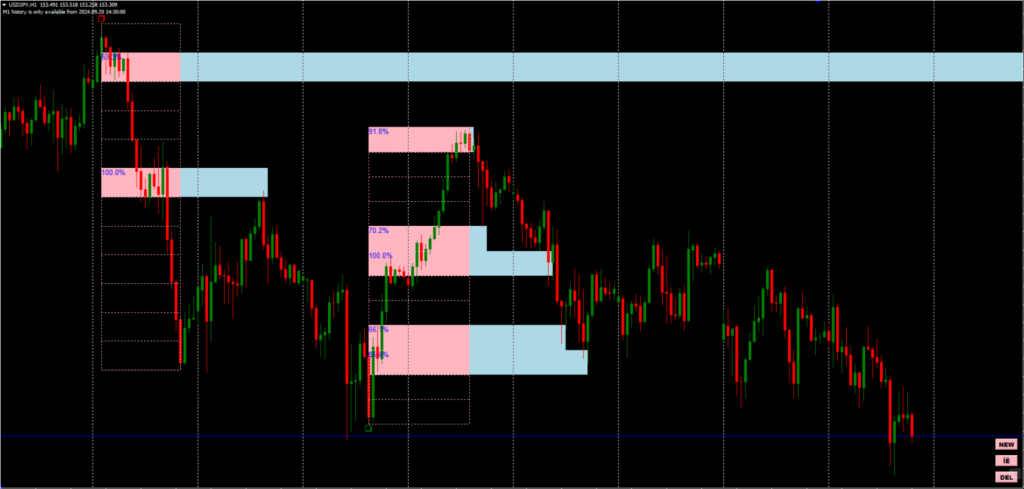
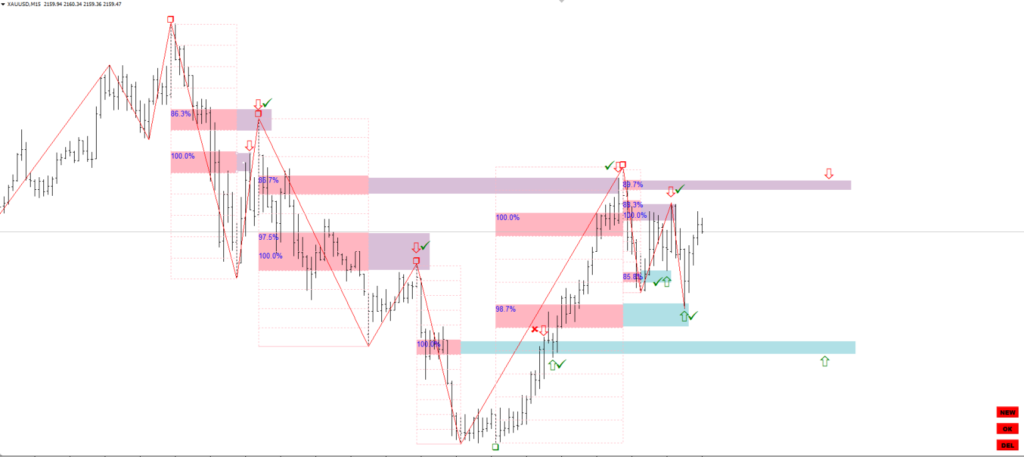
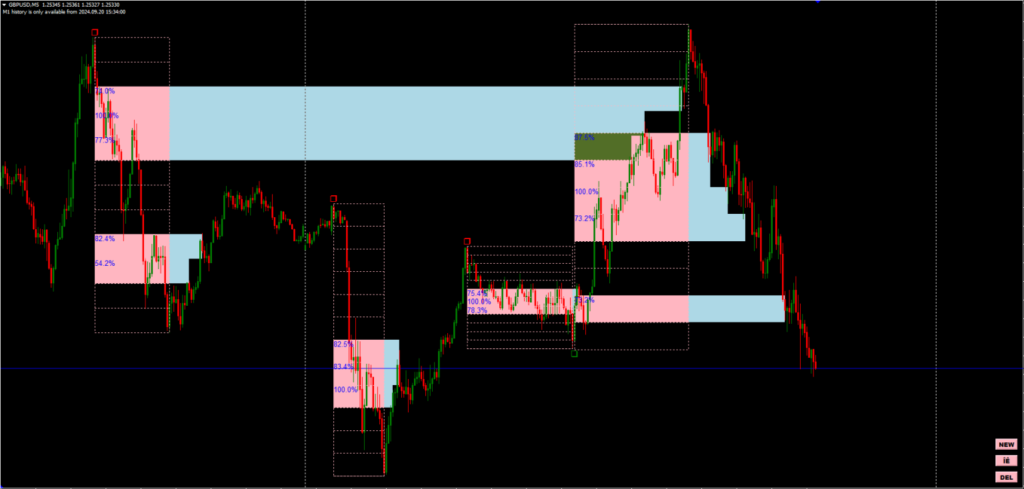
The Gann Swing Trading Indicator is a powerful tool for traders seeking to identify strong levels and optimize entry points based on swing analysis. Inspired by the mathematical principles of the legendary trader W.D. Gann, this indicator is versatile, working seamlessly across all trading instruments and timeframes.
The Swing Trading Indicator is particularly useful for traders who rely on technical analysis and level-based strategies. By analyzing market swings and leveraging the indicator’s grid system, users can identify potential reversal zones and refine their entry and exit points.
Key Features of this Swing Trading Indicator
- Manual Control for Precision – The Swing Trading Indicator is fully manual, offering control buttons for an interactive trading experience. Users can create and adjust segments to analyze specific movements, swings, or even a single candle.
- Easy-to-Use Interface – Pressing the NEW button generates a segment that can be placed on the desired price movement or candle. Once positioned, pressing the OK button activates a customizable grid within the segment.
- Customizable Grid Parameters – The grid appears after placing a segment, displaying percentages that traders can adjust to suit their strategies. These percentages indicate the probability of price reversals or corrections, helping traders make informed decisions.
- Focus on Levels – This Gann indicator emphasizes the importance of levels. Higher percentage levels within the grid suggest areas with a greater likelihood of price reversal or correction.
- Universal Application – Designed for flexibility, the indicator functions effectively across all instruments and timeframes, making it suitable for various trading styles.
How to Use Gann Swing Trading in Forex
Using the Gann Swing Trading in Forex involves a systematic approach to identifying optimal entry and exit points. Here are the steps to effectively use the indicator:
- Prepare Your Chart – Ensure you have loaded the M1 history for accurate data analysis. Select the forex pair and timeframe you wish to trade.
- Analyze Swings – Use the NEW button to create a segment on the chart. Place it over a price movement, swing, or single candle you want to analyze. Press the OK button to activate the grid, which overlays percentages on the selected segment.
- Interpret the Grid – Observe the grid levels and their percentages. Identify areas with higher percentages, as these levels often indicate a strong likelihood of price reversal or correction.
- Make Trading Decisions – Use the levels identified by the grid to place buy or sell orders. For example, if the price approaches a high percentage level and shows signs of reversal, consider entering a trade in the opposite direction.
- Incorporate Risk Management – Always set stop-loss and take-profit levels based on the grid’s insights. Avoid over-leveraging and ensure your trade aligns with your overall risk management plan.
- Monitor and Adjust – Continuously monitor the trade and adjust if the market conditions change. Reapply the indicator to new swings to stay updated with the latest market movements.

