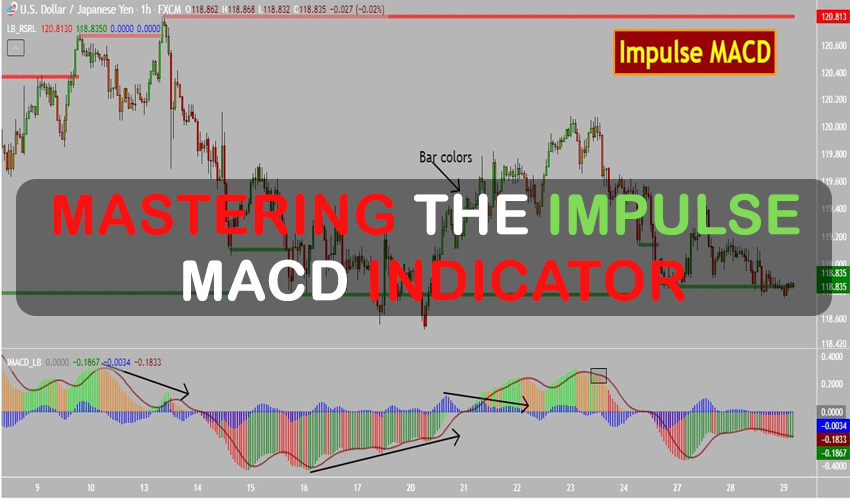
The Impulse MACD Indicator is a popular indicator used in trading. It uses moving averages to identify changes in trend strength and direction. It’s popular among traders and used in stocks, forex, and cryptocurrencies.
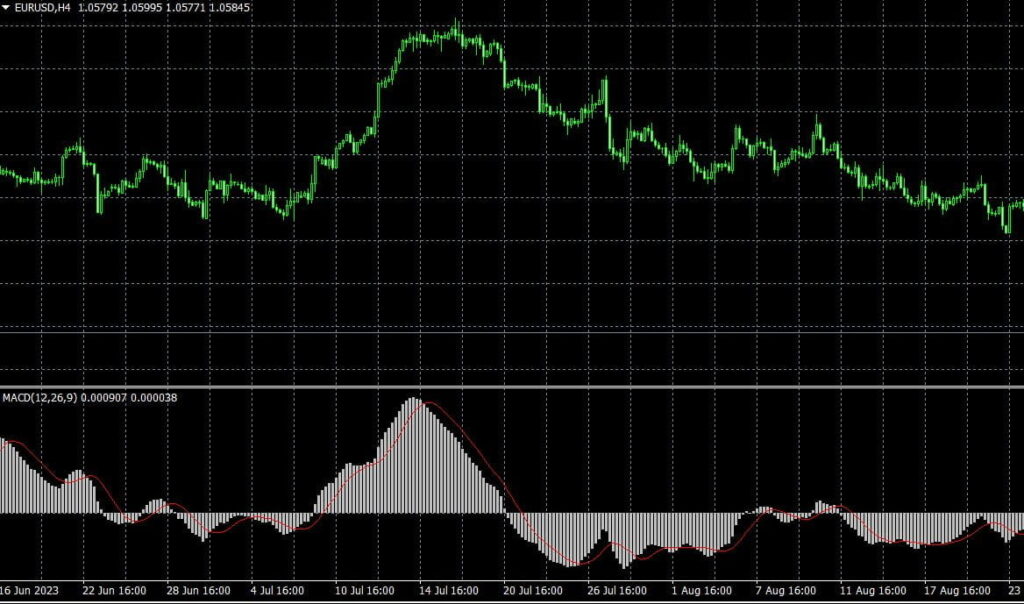
The MACD is calculated by subtracting two moving averages: signal and MACD line. The result is a histogram that displays how the two moving averages are related. If the MACD line is crossed above that signal line, it creates a “buy” signal. If the MACD line is below the line that signals, this creates a “sell” signal.
he MACD is used to find divergences, which can indicate trend reversals. A bullish divergence happens when the MACD line goes up while the price goes down. The upward momentum is increasing, even if the price is not, which may indicate a trend reversal. A bearish divergence happens when the MACD line has lower lows, and the price has higher lows. The downward momentum increasing without a price change could signal a trend reversal.
Historical development of the Impulse MACD
The Impulse MACD was developed by LazyBear in 2015. He was inspired by Alexander Elder, who created the Impulse System for trading. LazyBear wanted to create an indicator to spot Impulse System signals easily. He tried modifying the MACD indicator and developed the Impulse MACD.
The Impulse MACD is popular for accurate signals in various markets. It’s widely used on TradingView by traders worldwide, making it highly popular.
How to Use Impulse MACD Indicator for Trading
Step-by-step guide on interpreting Impulse MACD signals
To interpret Impulse MACD signals, traders should look for the following:
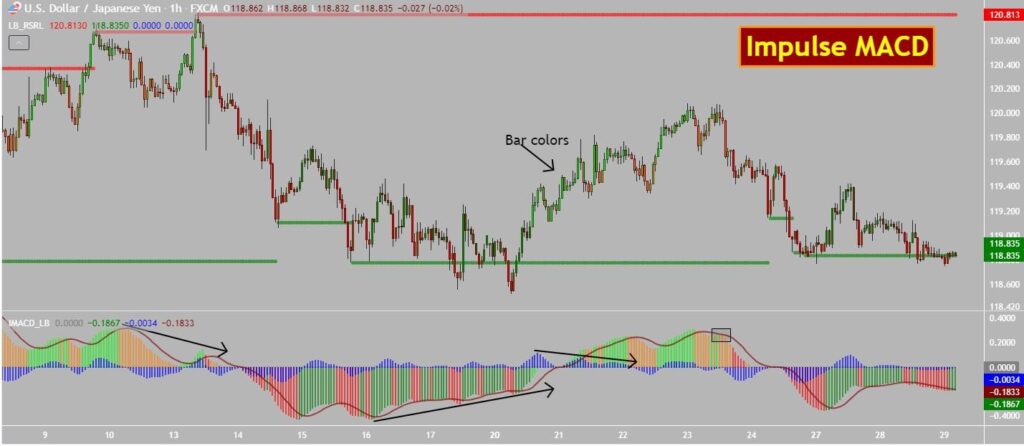
Signal line crossovers create buy signals when the Impulse MACD line crosses above. When the Impulse MACD line crosses below the signal line, it generates a sell signal.
Histogram bars are used to confirm signal line crossovers and measure trend strength. Positive and increasing histogram bars confirm a strong trend and valid buy signal. Negative, decreasing histogram bars imply a weakening trend and a valid sell signal.
Divergences can be used to detect possible trends that could be reversed. A bullish divergence happens when the Impulse MACD line goes up and the price goes down. A bearish divergence happens when the Impulse MACD line is lower while the price is higher.
Identifying bullish and bearish signals
Identify bullish and bearish Impulse MACD signals by looking for the following:
Bullish signals:
It is where the Impulse MACD line is over the line of signal. The Impulse MACD histogram bars are positive and increasing. There is a bullish divergence between the Impulse MACD line and the price.
Bearish signals:
It is where the Impulse MACD line runs beneath the line of signal. The MACD histogram bars are negative and decreasing. There is a bearish divergence between the Impulse MACD line and the price.